Six plays today quoted as 9 units. The ladder risks 12.38, because every figure is units to win rather than units at risk. Yesterday the shape of the card was four team total unders carrying half the exposure. Today it is four moneylines carrying three quarters of it, and two of those four are priced above minus 155. That is a different animal and the ladder shows why before any argument about baseball starts.
THE CARD
Reds vs Cubs Pick
Marlins vs Nationals Pick
Royals vs Guardians Pick
Astros vs Mets Pick
Rangers vs Brewers Pick
Orioles vs Athletics Pick
Every price above is the price taken. Chicago is 76-59, Cincinnati 64-71, Washington 64-73, Miami 68-67, Kansas City 61-75 and 9-1 in its last ten, Cleveland 68-67 and 8-2, Houston 68-67, the Mets 60-75, Texas 66-69, Milwaukee 84-51, Baltimore 66-68 and the Athletics 53-82. DraftKings had Cleveland at minus 161, the Mets at minus 142, Milwaukee at minus 162, Baltimore at minus 140 and the Wrigley under at minus 119 as this was written, so five of the six tickets were taken at a better number than the board was showing.
WHAT THE SIZING LADDER SAYS
| Leg | Price | Break even | Risk | Returns |
|---|---|---|---|---|
| Guardians moneyline | -157 | 61.09 percent | 3.14 units | 2.00 |
| Orioles moneyline | -129 | 56.33 percent | 2.58 units | 2.00 |
| Brewers moneyline | -160 | 61.54 percent | 2.40 units | 1.50 |
| Reds and Cubs under 9.5 | -115 | 53.49 percent | 1.73 units | 1.50 |
| Mets moneyline | -138 | 57.98 percent | 1.38 units | 1.00 |
| Marlins and Nationals under 8 | -115 | 53.49 percent | 1.15 units | 1.00 |
| Card total | 57.89 percent | 12.38 units | 9.00 |
Risk 12.38 to win 9.00 and the card breaks even at 57.89 percent. That is 1.19 points steeper than yesterday's nine leg ladder, which sat at 56.70, and the entire difference comes from the top of the table. Two prices at minus 157 and minus 160 need better than 61 percent each and together they carry 5.54 units. There is no leg cheaper than minus 115 anywhere on this card to pull the weighted average back down.
WHERE THE MONEY ACTUALLY SITS
Six plays for 9 units reads like six comparable opinions. The exposure table says two tickets own nearly half the day.
| Leg | Share of total risk | Share of total return | Gap |
|---|---|---|---|
| Guardians moneyline | 25.4 percent | 22.2 percent | Plus 3.2 |
| Orioles moneyline | 20.8 percent | 22.2 percent | Minus 1.4 |
| Brewers moneyline | 19.4 percent | 16.7 percent | Plus 2.7 |
| Reds and Cubs under | 13.9 percent | 16.7 percent | Minus 2.8 |
| Mets moneyline | 11.2 percent | 11.1 percent | Even |
| Marlins and Nationals under | 9.3 percent | 11.1 percent | Minus 1.8 |
A negative gap is the good kind. It means the leg returns a larger share of the card's upside than it consumes of the card's downside, which is what a cheap price does automatically. The Wrigley under at minus 115 is the best structured leg on the board by that measure, and the Marlins and Nationals under is right behind it.
The Guardians leg is the mirror image. Two units to win at minus 157 costs 3.14, a quarter of the night, and returns 22.2 percent of the upside. It is the only ticket that can move the day on its own, and it is pointed at a Kansas City club that has won nine of its last ten.
GROUPING THE LADDER BY BET TYPE
| Bet type | Legs | Risk | Return | Share of risk |
|---|---|---|---|---|
| Moneylines | 4 | 9.50 units | 6.50 | 76.8 percent |
| Game totals | 2 | 2.88 units | 2.50 | 23.2 percent |
Three quarters of the exposure sits on four teams winning games outright. That concentration is not a correlation problem, because the four games are in Cleveland, New York, Milwaukee and Sacramento with four separate pitching matchups. It is a price problem. Moneylines on good teams cost money, and buying four of them on one afternoon means the ladder needs a hit rate that would be comfortable at minus 115 and is not comfortable at minus 160.
THE STAKE LADDER RULE THIS CARD FOLLOWS
Every figure is units to win. The two 2 unit tickets return the same 2.00 and cost 3.14 and 2.58 respectively, a 22 percent difference in exposure for an identical payout, purely because one price is 28 cents more expensive than the other. That is the convention doing its job: it holds the reward constant and lets the market set the risk.
The alternative is worth quantifying because people copy ladders without checking the convention. Flat risking 2.06 units on all six legs instead would cut the Guardians position by 34 percent and raise the Marlins and Nationals position by 79 percent. Total return would rise from 9.00 to 9.28 on identical risk, and the card break even would fall from 57.89 percent to roughly 57.1. Neither approach is wrong. This site states which one is in use so the record can be audited against it.
THE WEAKEST LINK
The Guardians moneyline at minus 157. This exact ticket lost 3-0 yesterday in this exact ballpark against this exact opponent, and today it is back a size larger at a worse price. Kansas City has scored 5.33 runs a game across its last fifteen and is 9-1 in its last ten. Cleveland has allowed 2.93 runs a game across its own last fifteen behind a 3.73 staff ERA, which is the counterargument, but 3.14 units are riding on the resume beating the streak.
THE STRONGEST STRUCTURAL LINK
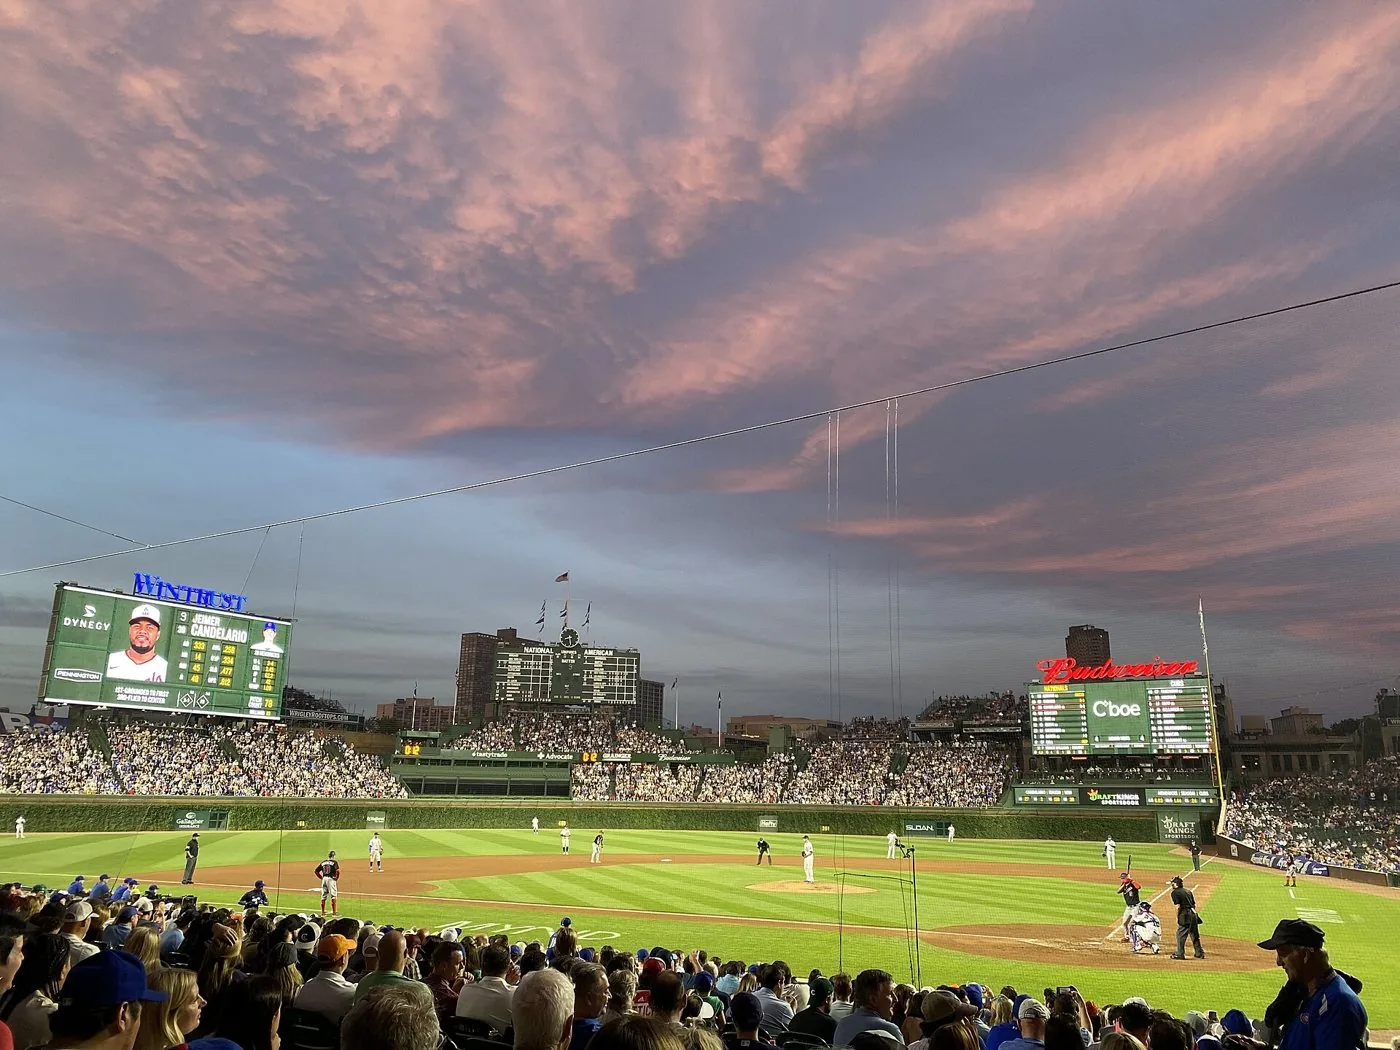
The Reds and Cubs under 9.5 at minus 115. Wrigley Field has hosted 66 games this season averaging 9.47 combined runs with 36 of the 66 finishing under 9.5, which is 55 percent against a price needing 53.49. Cincinnati games have gone under this number in 78 of 135. It is the cheapest price on the ladder, it consumes 13.9 percent of the risk for 16.7 percent of the return, and it is the only leg where the historical base rate already clears the break even without an argument attached.
FREQUENTLY ASKED
Why is a six leg card harder to beat than yesterday's nine leg card?
Because break even is weighted by risk, not by leg count. Yesterday four of nine prices sat at minus 120 or cheaper and dragged the weighted average to 56.70 percent. Today the two cheapest prices are both minus 115 and they carry only 2.88 of the 12.38 units. The expensive end of the ladder dominates.
Which single leg can ruin the day on its own?
The Guardians moneyline. It risks 3.14 units, 25.4 percent of the card. Losing only that ticket leaves the day at plus 5.86 units. Losing only the Marlins and Nationals under leaves it at plus 6.85.
Are four moneylines on one card too correlated?
No. Four separate games in four cities with four separate pitching matchups have almost nothing in common mechanically. The shared exposure on this ladder is a price exposure rather than an outcome exposure: every one of the four is a favorite, so a day where favorites underperform league wide hits all four at once through the same channel.
The August 28 Nine Leg Card The August 27 Three Leg Card MLB Picks Today2025-2026 Track Record Bankroll Management Guide Full Archive