Six plays today, five of them unders, and the shape of the ladder is the thing worth writing about before any of the matchups are. Quoted to win, the card is 11.5 units. Quoted the way a counter sees it, the card is 14.13 units at risk, and no single ticket is more than 26.5 percent of that. Yesterday two legs were 62.8 percent of the day. Today the two biggest are 44.2 combined. This is a flat card, and flat cards win and lose differently than top heavy ones.
THE CARD
Tigers vs Guardians Total Pick
Rays vs Rangers Total Pick
Braves vs Phillies Moneyline Pick
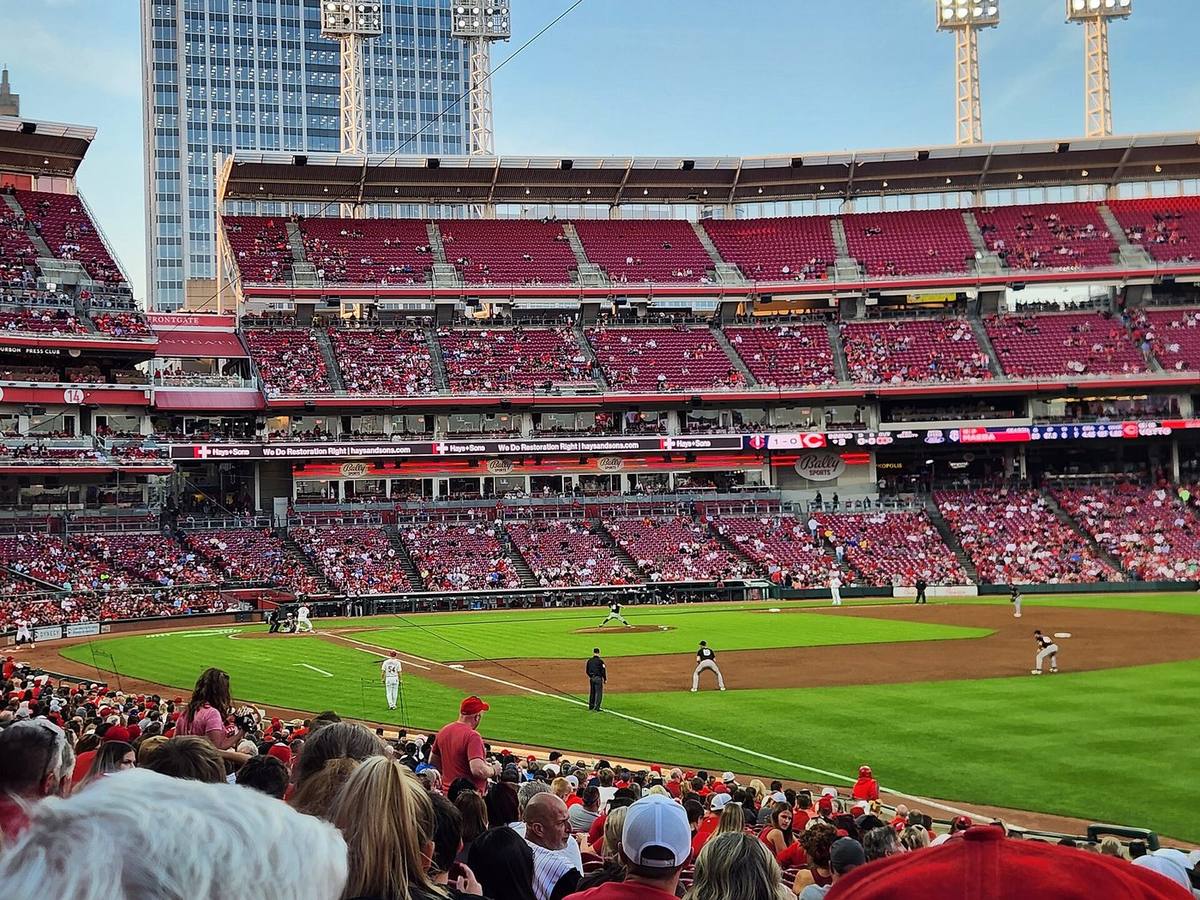
Brewers vs Reds Total Pick
Yankees vs Padres Total Pick
Giants vs Mets Total Pick
Every price above is the price taken. Records going in: Detroit 64-77, Cleveland 72-70, Tampa Bay 84-57, Texas 70-72, Atlanta 84-57, Philadelphia 79-62, Milwaukee 88-54, Cincinnati 67-74, New York 80-61, San Diego 74-67, San Francisco 58-84 and the Mets 64-77.
THE STAKE LADDER
Minus prices are quoted to win. Every price on this card is a minus price, so every line here risks more than it collects, and the spread between the cheapest and the most expensive is only 49 cents.
Risk by leg
Tigers and Guardians under 7, -125, 3 units to win. Risk 3.75, which is 26.5 percent of the day.
Rays and Rangers under 7, -125, 2 units to win. Risk 2.50, or 17.7 percent.
Phillies moneyline, -154, 2 units to win. Risk 3.08, or 21.8 percent.
Brewers and Reds under 9, -110, 1.5 units to win. Risk 1.65, or 11.7 percent.
Yankees and Padres under 7, -105, 1.5 units to win. Risk 1.58, or 11.2 percent.
Giants and Mets over 8, -105, 1.5 units to win. Risk 1.58, or 11.2 percent.
Total risk 14.13 units to collect 11.5. Break even is 14.13 divided by 25.63, which is 55.13 percent. Leg by leg the break evens run 55.56, 55.56, 60.63, 52.38, 51.22 and 51.22 percent. That is a card where the single most expensive ticket only needs 60.63 to hold, and that is a very different exposure profile than a day with a -300 leg on it.
WHY FLAT MATTERS
A top heavy card is decided by one game. On September 4 this site counted a ladder where two tickets were 62.8 percent of the risk, which means the other four legs were, in a bankroll sense, noise. Today the largest leg is 26.5 percent and the smallest is 11.2. Going 3-3 on a flat card is close to break even. Going 3-3 on a top heavy card can be a large loss or a large win depending entirely on which three.
There is a cost to it. A flat card has more ways to lose money while being right about most of the day, because the win rate needed does not fall as fast when no single leg dominates. At 55.13 percent break even across six legs, four wins is a profit and three is a loss of roughly 0.6 units. The margin is thin in both directions.
THE 26.5 PERCENT TICKET
The largest leg is Detroit and Cleveland under 7 at -125, and it is built almost entirely on one arm and one lineup.
Parker Messick has been the quietest good season in the American League. Twenty seven starts, 2.46 ERA over 161.0 innings, 1.02 WHIP, and he is at home at Progressive Field. That is the best ERA of any starter on this card.
The other half is the Cleveland lineup, which is the weakest on the slate. The Guardians are 72-70 and score 4.06 runs a game on a .686 OPS, both the lowest figures among the twelve clubs on this card. Detroit brings a 3.72 staff ERA and allows 4.07 a game, so the side of the total that Cleveland has to supply is the side least likely to supply it.
The case against is Framber Valdez, who is the weakest starter in this particular game at 4.36 over 150.2 innings with a 1.40 WHIP. Detroit scores 4.39 a game. If seven runs land here, four or five of them come from the Tigers in the first five innings, and that is the honest way this loses.
THE ONE OVER
Five unders and one over is not a system, it is where the arms fell. The over is Giants and Mets at 8, and the reason is that San Francisco is not starting a starter. Anthony Molina has 5.0 innings on the season, zero starts, a 5.40 ERA and a 1.40 WHIP. That is a bullpen day in disguise. San Francisco is 58-84 with a 4.40 staff ERA allowing 4.71 a game, the worst run prevention number on the card.
Zac Thornton is the better arm here at 2.93 over 61.1 innings across 11 starts, so the Mets half of this is suppressed and the Giants half is not. Eight is a low number for a game where one side has no defined starter. It is 1.5 units and not more because the Mets score 4.16 a game on a .697 OPS and are not the offense you want carrying an over by themselves.
THE PRICE ON THE PHILLIES
The only side on the card and the most expensive ticket. Zack Wheeler is 23 starts, 3.31 over 130.1 innings with a 1.09 WHIP, at home. Martín Pérez has been better than his reputation at 3.05 over 121.0 innings, 1.21 WHIP, which is why -154 is a real price and not a giveaway.
Atlanta at 84-57 is the better team on the season and it is not close on run prevention, a 3.57 staff ERA against Philadelphia's 4.00. The bet is the specific matchup rather than the season. Philadelphia scores 4.49 a game to Atlanta's 4.67, so the offenses are close, and what is being paid for is Wheeler at home over one start. At -154 that needs to be right 60.63 percent of the time.
THE PARK QUESTION ON THE BREWERS
Under 9 at Great American Ball Park with the highest scoring team in baseball in the visiting dugout is the leg that looks wrong, so it gets explained rather than buried. Milwaukee is 88-54 and scores 5.04 a game on a .739 OPS, the best offensive profile of anyone playing tonight, in a park that has rewarded that profile for twenty years.
The reason nine still holds is the other three quarters of the game. Milwaukee's staff has a 3.50 ERA and allows 3.81 runs a game, the best run prevention on this card outside the Yankees. Cincinnati is 67-74 and scores 4.17. For this to go over, the Reds have to find five against a Brewers staff that has not allowed five a game to anybody, or Milwaukee has to put up seven or eight on its own against a 4.68 team ERA. The second is live. The first is not, and a nine run total usually needs both halves to participate.
THE CORRELATION QUESTION, MEASURED
Five unders on one slate is usually described as a correlated position, on the theory that if the ball is carrying across the league tonight the card does not lose one leg, it loses four. That theory is testable and it does not hold up.
Across 2,122 games of the 2026 season, the intraclass correlation of combined runs within a calendar date is 0.0056, and a permutation test on the same data returns a p value of 0.31. Drawing five games at random from a single slate, all five finish under 8.5 3.44 percent of the time against an independent 3.40. The daily under share has actually bounced around slightly less than independence predicts.
So the honest version is the boring one. These are five bets, not one. What would make this a bad day is five wrong opinions, spread across five parks and ten starters, and the ladder above is a fair description of the exposure rather than a flattering one. The season long drift is where run environment actually moves: May averaged 8.61 combined runs and June 9.35. A single night is not a condition.
The September 4 Six Leg Card The September 3 Two Leg Card MLB Picks Today2025-2026 Track Record Bankroll Management Guide